Past exams / 2023 CAP (Junior High Assessment) – Math
2023 CAP (Junior High Assessment) – Math, Question 24
Source: 2023 CAP Mathematics (source: National Academy for Educational Research and the Research Center for Psychological and Educational Testing, National Taiwan Normal University)
Question 24
24. Figure 15 is a line graph created by an organization in 2020 showing the percentage of the population aged 65 and older out of the total population in four countries, where the values after 2020 are projections.
Based on Figure 15, which of the following countries takes the shortest time to transition from entering an "aged society" to entering a "super-aged society"?
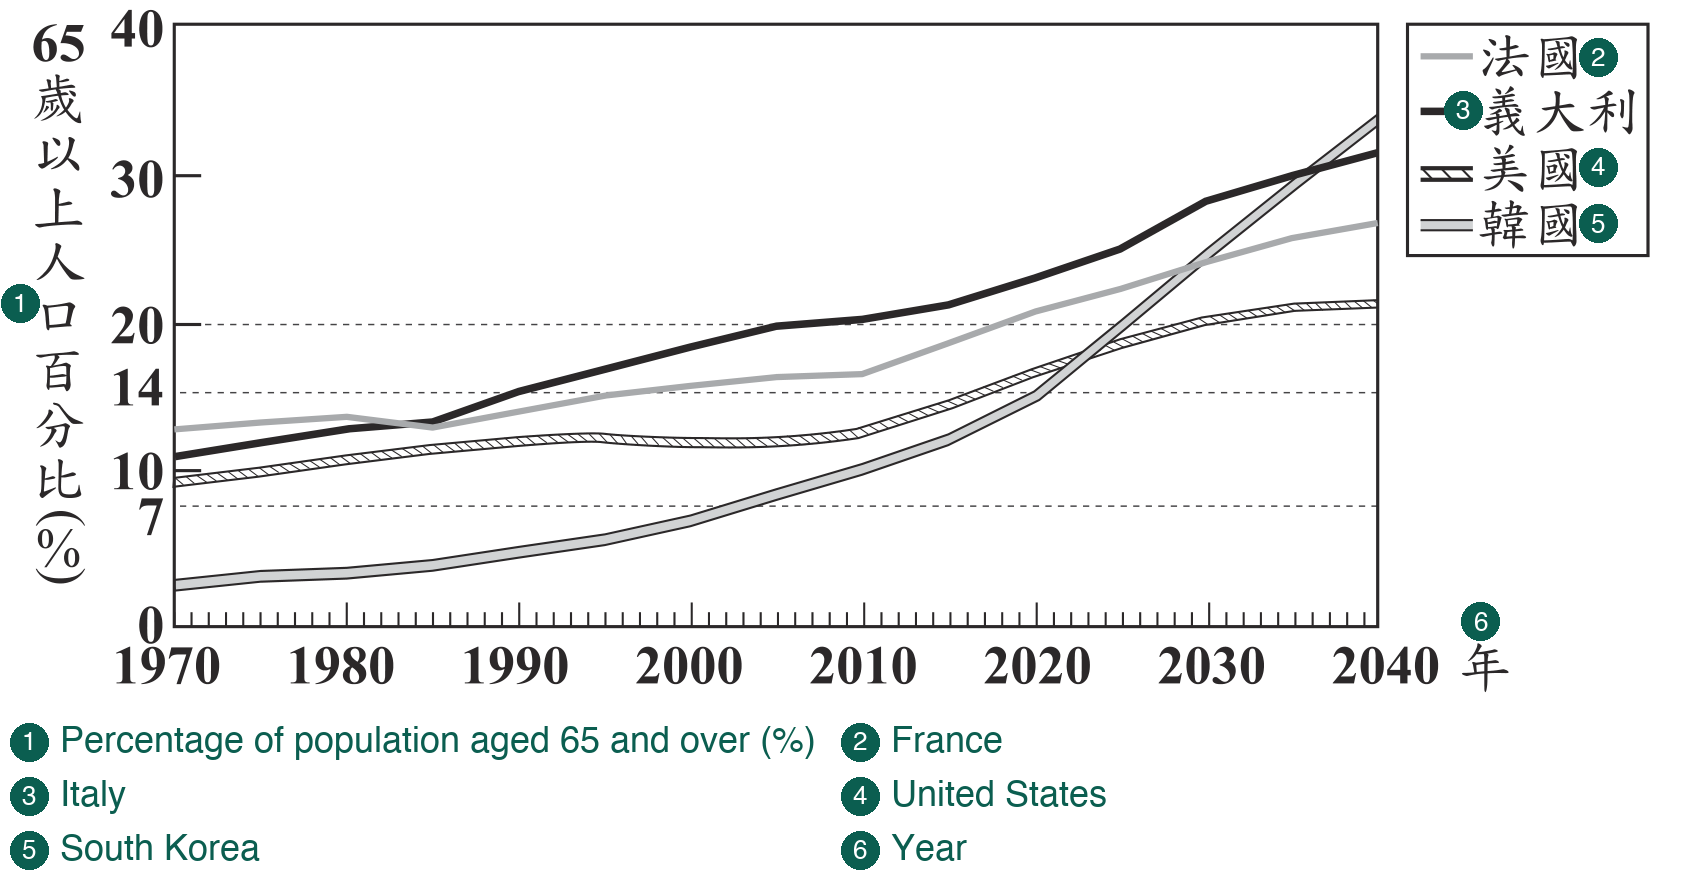
Figure 15
(A) France
(B) Italy
(C) United States
(D) South Korea
Based on Figure 15, which of the following countries takes the shortest time to transition from entering an "aged society" to entering a "super-aged society"?
Figure 15
(A) France
(B) Italy
(C) United States
(D) South Korea
Answer:D
This question has an AI blackboard walkthrough with narration, playable on the web or in the app.
SaiTutor: snap a photo of a problem and an AI tutor works through it on a blackboard, out loud. Get the app