Past exams / 2018 CAP (Junior High Assessment) – Math
2018 CAP (Junior High Assessment) – Math, Question 19
Source: 2018 CAP Mathematics (source: National Academy for Educational Research and the Research Center for Psychological and Educational Testing, National Taiwan Normal University)
Question 19
19. It is known that Class A and Class B have the same number of students. Figure 9 shows the
box plots of the scores of the two classes on a math quiz. If the medians of the quiz scores of Class A and Class B are and , respectively, and
the numbers of students in Class A and Class B who scored over points on the quiz are and , respectively, which of the following relationships among , , , and
is correct?
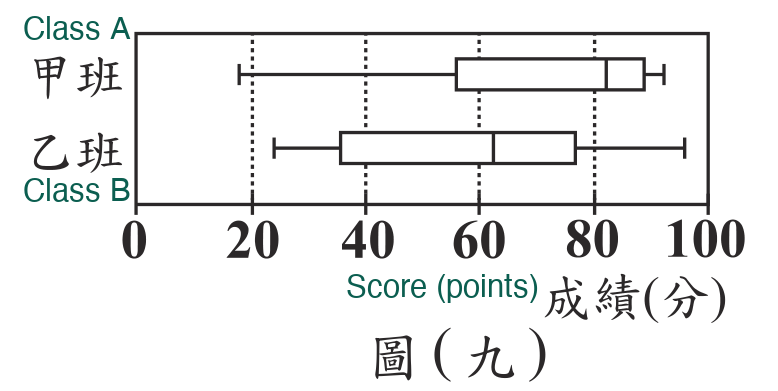
Figure 9
(A) ,
(B) ,
(C)
(D) ,
box plots of the scores of the two classes on a math quiz. If the medians of the quiz scores of Class A and Class B are and , respectively, and
the numbers of students in Class A and Class B who scored over points on the quiz are and , respectively, which of the following relationships among , , , and
is correct?
Figure 9
(A) ,
(B) ,
(C)
(D) ,
Answer:A
This question has an AI blackboard walkthrough with narration, playable on the web or in the app.
SaiTutor: snap a photo of a problem and an AI tutor works through it on a blackboard, out loud. Get the app